


C-15 3rd Floor, Amar Colony Main Market,
Lajpat Nagar - 4,
New Delhi - 110024, India
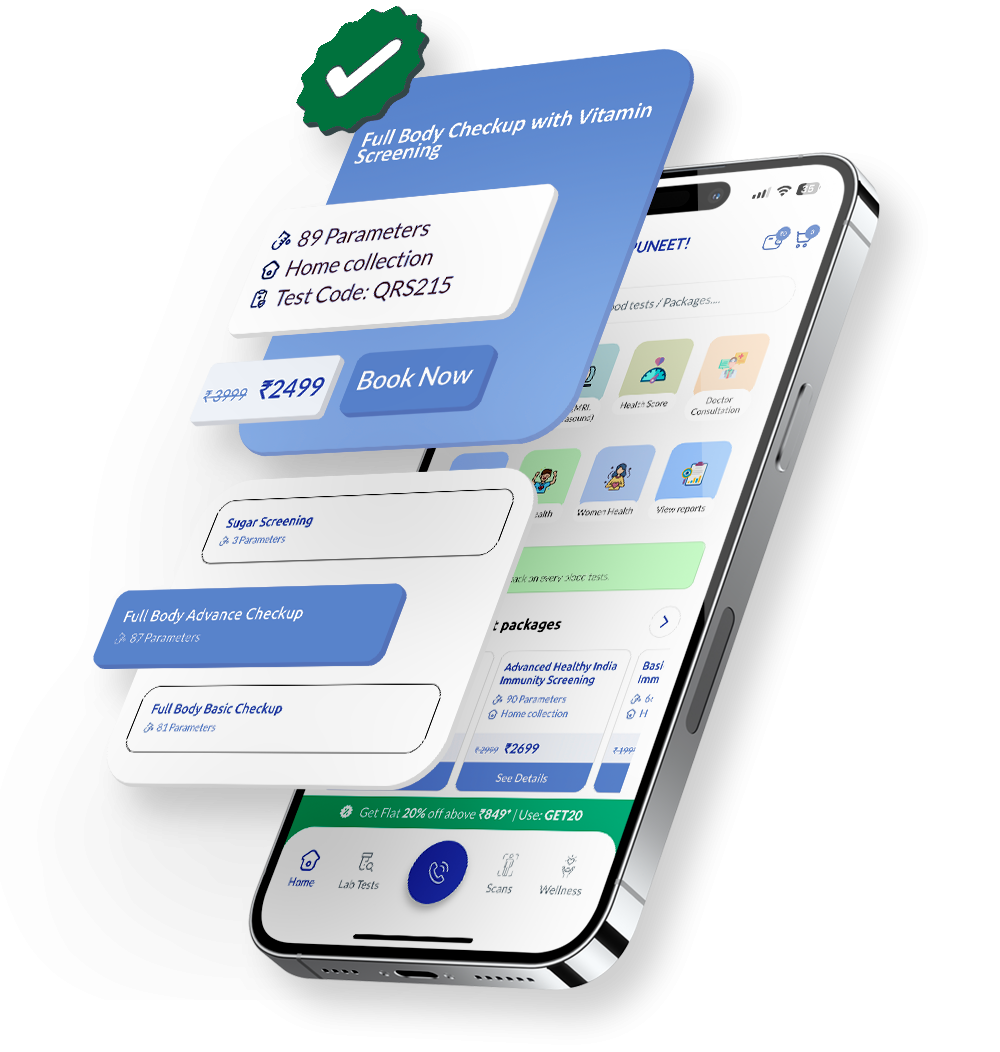
A fully white-label, ready-to-deploy digital system built specifically for diagnostic centres. Digitise your entire workflow from online booking to report delivery, with full control over pricing, patients and data.

Many diagnostic centres struggle with:
A basic website is not enough.
What’s needed is a complete diagnostic workflow system.

This platform brings together:
All delivered as a private, white-label platform, fully customised to your diagnostic centre.
.webp)
Customer books tests or packages online.
Admin receives instant notification.
.webp)
Admin assigns a flebo for home collection.
Customer and flebo both receive assignment notification.
.webp)
Flebo collects the sample and submits TRF digitally.
Customer confirms sample collection via OTP before TRF submission.

Sample is processed in the lab as per standard procedures.
Status update sent to customer.

Reports are uploaded securely.
Customer receives report notification via SMS and email.
No manual follow-ups required.

Most teams don’t start by looking for a diagnostics service. It usually begins with a slow system, unclear reports, or decisions that feel delayed for no clear reason. One issue leads to another. Performance touches infrastructure. Data accuracy links back to application logic. Small gaps start to overlap. In practice, businesses rarely need a single fix. They move between stabilising systems, improving visibility, and then tightening control. A change in one layer often exposes limits in another. That’s where connected thinking becomes useful. You might begin by understanding what’s happening inside your current setup. From there, questions around scalability, security, or integration tend to follow. Not all at once, but gradually. And each decision shapes the next.


Some teams come in with very clear systems. Structured, documented, but something still feels off. Others are in the middle of change. New tools, partial migrations, a mix of old and new working together. We’ve worked with businesses where reporting looked right on the surface, until you looked closer. And with teams where nothing was broken, just slower than it should be. A few clients had already tried fixes before reaching out. Internal efforts, external vendors. Different approaches. There are also those who simply want clarity before making the next move. Different stages. Different expectations. The conversations tend to be practical. Focused.
This is the "Ghost Service" syndrome. Your zmcontrol status might show all green, but your MTA (Mail Transfer Agent) could be trapped in an I/O wait cycle. JIL runs a Deep-Packet Audit to see if your mail queue is ballooning due to an "Open Relay" exploit. It’s Protocol Friction. We check the /var/log/zimbra.log for "Connection Denied" strings that standard monitors miss. We ensure your ₹10 Lakh ($10,851) hardware isn't just "running"—we make sure it's actually delivering.
Absolutely. If your server’s /etc/resolv.conf is pointing to a slow public DNS, every database query and mail lookup hangs for 2-3 seconds. This is Lookup Latency. JIL’s diagnostic protocol involves a Trace-Route Stress Test. We pinpoint exactly where the handshake is dropping between your Noida office and the global web. We don't guess; we use MTR and Dig to prove where the network bottleneck is, saving you from a ₹15 Lakh ($16,277) "unnecessary" bandwidth upgrade.
Standard task managers won't show this. You need to look at the Mailboxd Thread Dump. JIL performs a JVM (Java Virtual Machine) Analysis to identify "Leaky Threads" or users running massive IMAP syncs that crush the server's NewGen memory. This is Resource Starvation. We find the specific "Top-Talker" account and cap their session limits, preventing a single user from crashing the entire infrastructure for the rest of the company.
This is a CDN or Path-MTU mismatch. Your local cache makes the site look "healthy" to you, but external visitors are hitting a "Bottleneck Node." JIL uses Global Node Simulation to test your site's "Time to First Byte" from multiple Delhi-NCR entry points. If your "Online Presence" is lagging, our diagnostics identify if it's a Server-Side Script or a Third-Party API call that’s hanging. We kill the "Performance Lag" before it kills your conversion rate.
Most admins just reboot. That’s a mistake. JIL runs an Active Process Audit on your MySQL/MariaDB stack. We look for "Unindexed Queries" that are locking up the table. This is Database Gridlock. We identify the specific "Slow Query" that’s eating your CPU. By adding a single index or killing a "Hanging Thread," we restore service in seconds, avoiding the ₹10 Lakh ($10,851) downtime cost of a full system hard-reset.
We don't wait for the "Connection Refused" alert. JIL sets up Predictive Log-Watching. We monitor the Load Average and Disk-Wait trends. If we see your /opt/zimbra partition filling up at a rate of 5GB/hour, we trigger a "Cleanup Script" or an "Auto-Expand" event. This Self-Healing Architecture ensures that "Temporary Resource Issues" never turn into a total "Service Down" event for your high-value Delhi enterprise users.